
The Ultimate Beginner’s Guide to Wireshark 4.6.5
Wireshark 4.6.5 just dropped 3 days ago, more than enough reason to revisit it, I wrote about and years ago but its time to do some new…

Wireshark 4.6.5 just dropped 3 days ago, more than enough reason to revisit it, I wrote about and years ago but its time to do some new article about it.
Because the proof is in the packets.
The Scenario You’ve probably Lived Through
It’s 2:47 PM on a Friday. The CFO just messaged you: “The network is slow.”
You ping the server. 1ms. Healthy. You run a speed test. 940 Mbps down. Healthy. You restart your switch out of muscle memory. Still “slow.” Now Sales is complaining. The CRM “won’t load.” Someone in Marketing is convinced the Wi-Fi “ate” their email.
Here’s the truth nobody tells you in those CompTIA study guides: the network is almost never the network. It’s a TCP retransmission storm. It’s a DNS resolver timing out. It’s a TLS handshake failing because someone’s clock drifted 47 seconds. It’s a RST flag fired by a load balancer that nobody configured.
You will never find this stuff by staring at a dashboard. Or pinging a server.
You find it by looking at the packets.
That’s where Wireshark comes in. Think of it as the X-ray machine for the internet, every conversation your machine has with the outside world, broken down frame by frame, byte by byte. Routers carry the packets. Firewalls block the packets. Your app talks in packets. And until you can see them, you’re guessing.
This guide gets you from zero to actually-useful in Wireshark 4.6.5, the April 29, 2026 release. Let’s go.
The Basics: What Even Is a Packet?
Before we open the tool, let’s get the foundation right.
A packet is a small, self-contained unit of data your computer sends over the network. When you load google.com, your machine doesn't fire one giant blob of "give me Google." It fires dozens of tiny envelopes — each one wrapped in layers of headers like a Russian nesting doll:
- Ethernet (the physical address layer — MAC to MAC)
- IP (the routing layer — who’s the source, who’s the destination)
- TCP or UDP (the transport layer — sequencing, reliability, port numbers)
- The application (HTTP, DNS, TLS, the actual data you care about)
Wireshark captures these envelopes off the wire (or out of the air), unpacks every layer, and shows you exactly what’s inside.
What Wireshark Does
- Captures live traffic from your network interfaces
- Decodes 3,000+ protocols into human-readable form
- Lets you filter, search, follow conversations, export streams
- Tells you exactly when, where, and why something went wrong
What Wireshark Does NOT Do
- It does not send packets, attack networks, or “hack” anything
- It does not decrypt traffic by default (TLS is encrypted; you need keys)
- It does not see traffic that isn’t reaching your NIC (mirror ports / TAPs exist for a reason)
- It is not an IDS, a firewall, or a packet generator
Pro-Tip: If you’re capturing on a switched network and only seeing your own traffic, that’s not a Wireshark bug — that’s how switches work. You need a SPAN/mirror port, a network TAP, or you need to capture on the host you’re troubleshooting. Many a junior engineer has filed a bug report on this. Don’t be that engineer. Don’t be that guy!
Getting Started: Your First Capture
Download from wireshark.org, install, launch. In 4.6.5, you'll notice the redesigned start page — cleaner, with a new sidebar of tips and tricks the team added based on years of "where do I even click?" feedback. (Hate the sidebar? Documentation says can disable it in Edit → Preferences → Appearance. On my Mac, that was true, on my windows machine, that was not an option that I could find.)
Step 1: Pick the Right Interface
The start page lists every interface on your machine, Ethernet, Wi-Fi, loopback, VPN tunnels, sometimes a dozen virtual adapters from Docker, VMware, and that VPN client you forgot you installed. Look at the little sparkline next to each one. The one that’s wiggling is the one carrying live traffic. Double-click it.
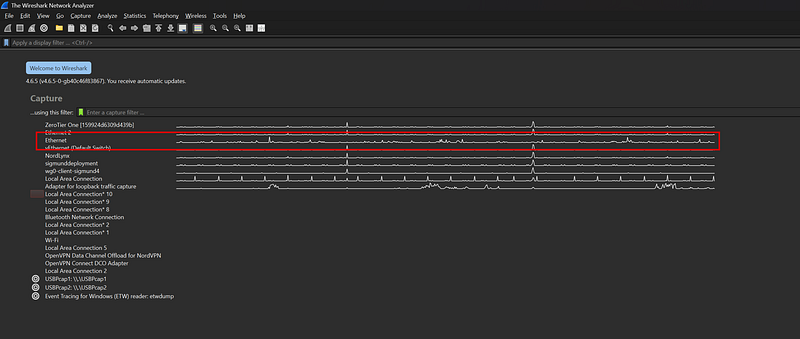
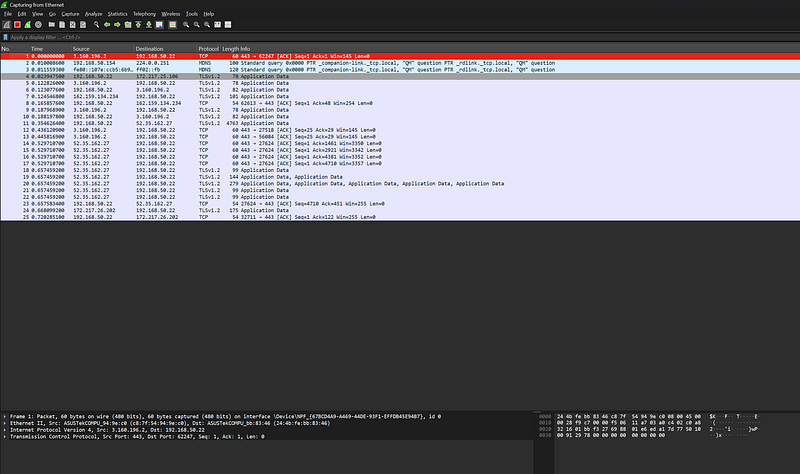
Packets start flowing. Welcome to the matrix.
Step 2: Stop Treating It Like a Default Tool
Here’s where 90% of beginners go wrong: they use Wireshark out of the box and wonder why it feels overwhelming. The single most important thing you can do as a new packet analyst is build a Custom Profile.
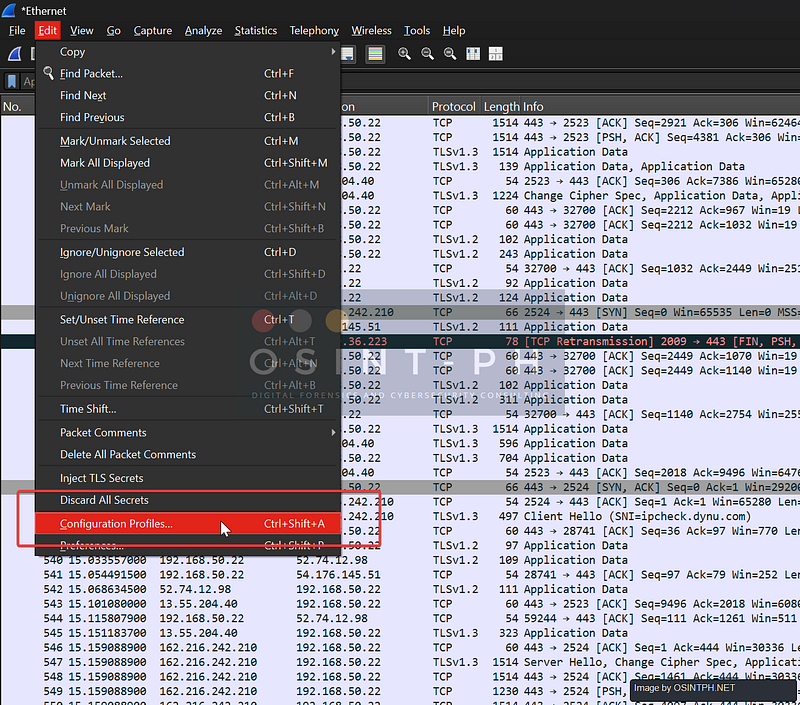
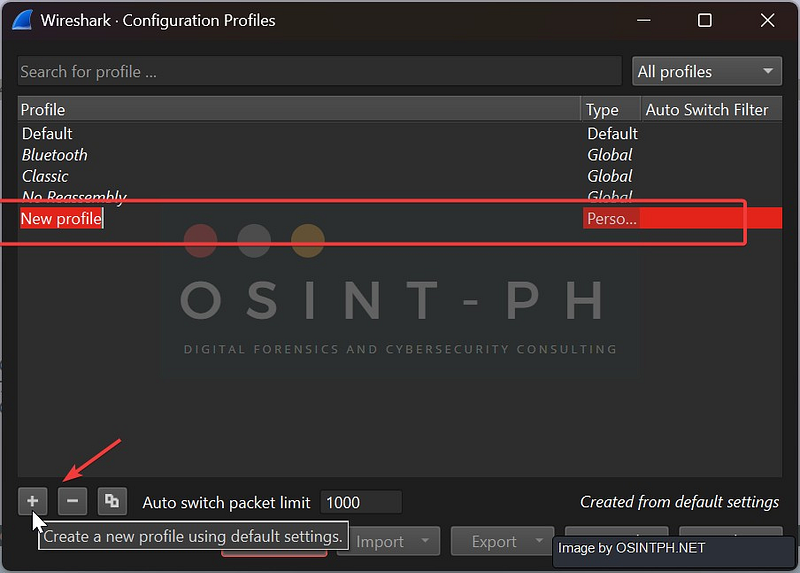
Step 3: Create a Custom Profile
Go to Edit → Configuration Profiles → New. Name it something like troubleshooting or tcp-perf. This profile holds your columns, your coloring rules, your filters, your preferences — all separate from the default. You can have a profile for VoIP, one for HTTP/2, one for security work. Switch between them with one click in the bottom-right corner.
Pro-Tip: Never analyze in the default profile. The default is for the project’s developers, not for you. Your profile is your toolkit. Build it once, save it, version it in Git, share it with your team. This single habit will separate you from every junior engineer who’s been “using Wireshark” for three years and still drowns in it.
Step 4: Add Custom Columns — The Right Way
The default columns (No., Time, Source, Destination, Protocol, Length, Info) are fine, but they hide performance problems. You want to add columns that surface timing and TCP state.
The fastest way to add a custom column is from the packet details pane, not the Preferences dialog. Here’s how:
- Click any TCP packet in the packet list
- In the packet details pane (middle), expand the Transmission Control Protocol section
- Scroll to the bottom and expand [Timestamps]
- Right-click on [Time since previous frame in this TCP stream]
- Choose Apply as Column
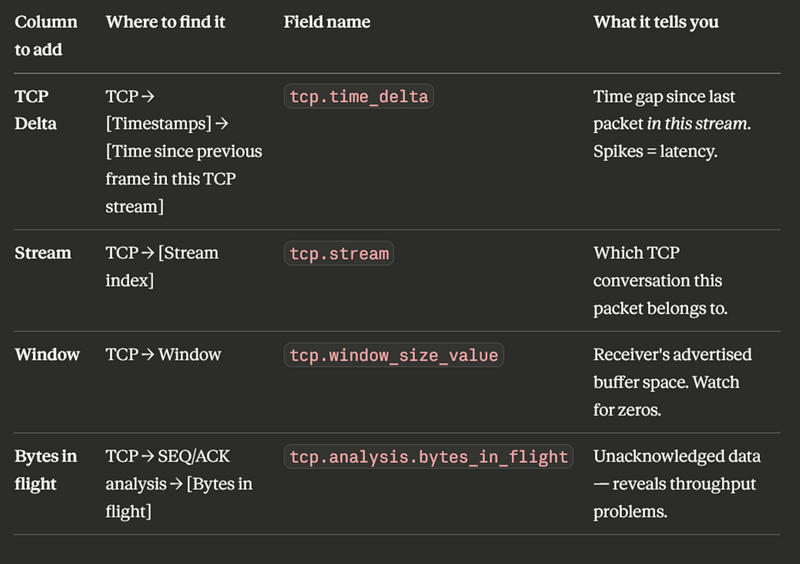
Done. Wireshark adds a column for the field tcp.time_delta. Right-click the column header to rename it ("TCP Delta") or resize it.
This same trick works for any field anywhere in the packet details. Window size? Right-click → Apply as Column. HTTP host? Right-click → Apply as Column. It’s the single best workflow shortcut in Wireshark.
Important: tcp.time_delta only populates if "Calculate conversation timestamps" is enabled. Go to Edit → Preferences → Protocols → TCP and tick that box. Without it, the [Timestamps] section won't even appear in the packet details. This trips up almost everyone the first time.Step 5: The Columns Worth Adding
Use the right-click → Apply as Column trick for each of these. Here’s what to look for in the packet details pane and what each one tells you:
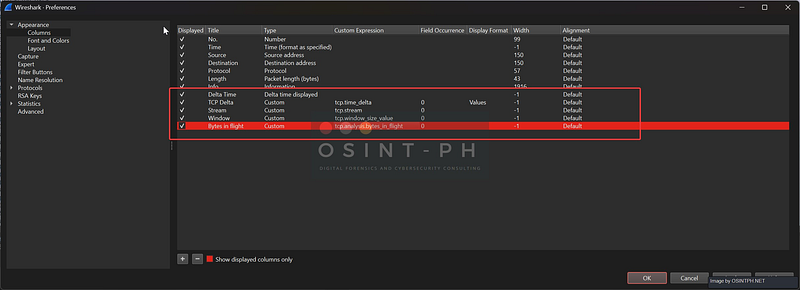
For a “Delta time displayed” column (time since the previous displayed packet, regardless of stream), the Preferences dialog has a built-in preset: Edit → Preferences → Appearance → Columns → +, then set Type to Delta time displayed. No Custom Expression needed for that one.
If you do go through the Preferences dialog instead of right-clicking: The dialog has these columns — Displayed | Title | Type | Custom Expression | Field Occurrence | Display Format | Width | Alignment. To add a TCP Delta column manually:- Click the + button to add a new row
- Set Title to
TCP Delta - Set Type to
Custom - In the Custom Expression column, type
tcp.time_delta - Leave Field Occurrence at 0
- Click Apply
Same pattern for any custom field. But Apply as Column is faster.
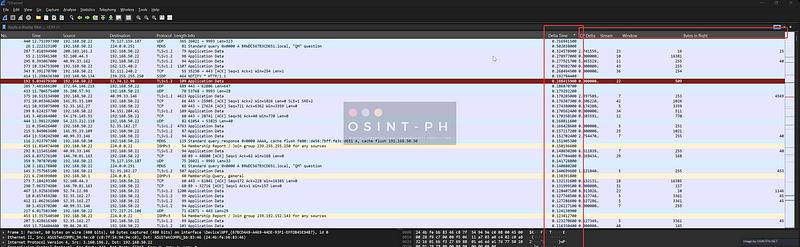
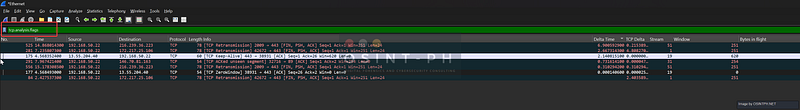
Now sort the trace by TCP Delta (descending). The packets at the top are the ones with the longest gaps before them — and those gaps are exactly where your performance problems live.
Common Use Cases: The Two Tickets You’ll Always Get
“The Network Is Slow”
This phrase is meaningless. Slow how? Slow when? Slow for whom? Wireshark cuts through the vibes:
- Capture on the affected host while reproducing the slowness
- Sort by TCP Delta descending
- Look at the top 10 packets — what’s happening before each big gap?
- Big gap before a SYN-ACK? → Server-side latency, possibly a full TCP backlog
- Big gap before a server response? → Application is slow, not the network
- Big gap before an ACK from the client? → Client-side issue (CPU, buffer, GC pause)
- Lots of
[TCP Retransmission]packets? → Real packet loss somewhere on the path
The packets don’t lie. The user’s perception is real, but the cause is in the trace.
“The App Is Down”
Different beast. Now you’re looking at:
- Is the TCP three-way handshake completing? (SYN → SYN-ACK → ACK)
- Is the server sending TCP RST (reset)? That’s an active rejection.
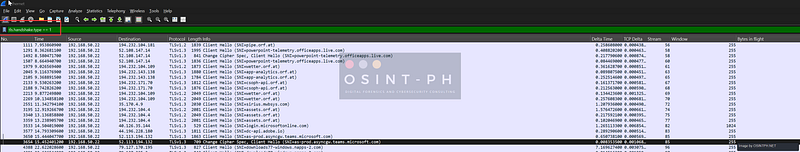
- Is TLS failing? Filter for
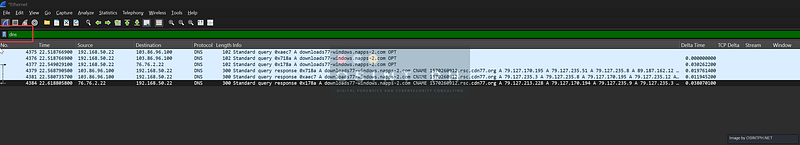
tls.handshake.type == 1and look for missing Server Hellos. - Is DNS even resolving? Filter
dnsand look for responses with a non-zero rcode.
If you don’t see a SYN-ACK, the server isn’t listening on that port (or a firewall ate it). If you see a RST right after the SYN-ACK, something — application, load balancer, IPS — is actively closing the door. The proof is in the packets.
The Power of Filters: 6 to Memorize Today
Wireshark has two kinds of filters, and the difference matters:
- Capture filters (BPF syntax) decide what gets recorded to disk. Applied before save. Permanent. Limited syntax.
- Display filters (Wireshark syntax) decide what gets shown from a capture you already have. Reversible. Powerful.
Pro-Tip: Capture everything, filter on display. Disk is cheap. Re-running the bug to get more packets is expensive. Use a capture filter only when traffic volume would crush your laptop. Otherwise, capture wide, filter narrow.
Six display filters every analyst should know:
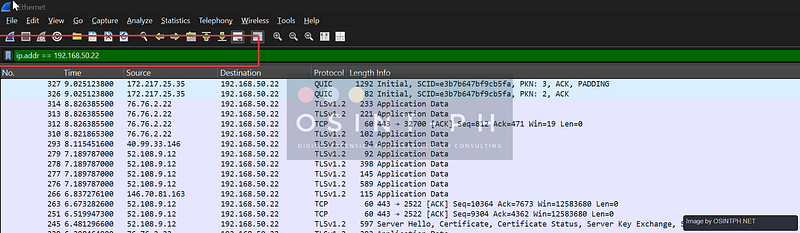
ip.addr == 192.168.50.22All traffic to or from this host.
tcp.flags.reset == 1Show me every TCP RST. Connections being slammed shut. Always worth investigating.

tcp.analysis.flagsWireshark’s expert system flagging anything weird in TCP — retransmissions, duplicate ACKs, zero windows, out-of-order packets. The “what’s broken” filter.
http.requestEvery outbound HTTP request. Pair with http.response to see what came back.
dnsAll DNS traffic. Add && dns.flags.rcode != 0 to find only the failures.
tls.handshake.type == 1The TLS Client Hello — the start of every encrypted conversation. If you see one with no Server Hello after it, something is killing your TLS sessions.
Pro-Tip: The filter bar turns green (valid), red (broken), or yellow (probably valid but ambiguous). Watch the colors. Save your favorites as bookmarks via the ribbon icon on the left of the filter bar.
What’s New in 4.6.5 (April 2026)
This release is heavy on security and stability:
AI-Assisted Vulnerability Discovery
The headline of 4.6.5 is that the Wireshark team patched 40+ vulnerabilities in a single release. The release notes openly attribute the volume to “a recent trend in AI-assisted vulnerability reports”, researchers pointing LLM-driven fuzzers and code analyzers at the dissector codebase, finding bugs at a pace traditional review can’t match. This is the new normal for open-source security in 2026, and Wireshark is leaning into it.
Critical Patches
- TLS dissector (CVE-2026–5402) — crash with possible code execution on malformed TLS traffic
- RDP dissector (CVE-2026–5405) — same class of bug, possible code execution
- SBC codec (CVE-2026–5403) — code execution on crafted audio payloads
- Profile importer (CVE-2026–5656) — code execution if you import a malicious profile
If you analyze captures from untrusted networks (and most interesting captures are from untrusted networks), upgrade immediately.
Quality-of-Life Wins
- Redesigned start page with a tips/tricks sidebar
- SMB2 decryption keys now persist on restart (incident responders, rejoice)
- Follow Stream font no longer turns proportional after zooming on Windows
- Npcap 1.87 bundled (fixes earlier BSOD issues)
- Qt 6.10.3 for the UI
- Dissector updates across QUIC, HTTP/2, DNS, BGP, ISAKMP, SMB2, IPv6, IEEE 802.11, and more
Pro-Tip: Profiles are plain folders of text files on disk. Find them via Help → About Wireshark → Folders → Personal configuration. Back them up. And given the new profile-importer CVE, only import profiles from people you actually trust.
The Authority Angle: Don’t Just Look at the Colors
Here’s the philosophy that will make you actually good at this.
Don’t just look at the colors. Look at the conversation.
Wireshark colors packets by default — green for HTTP, light blue for DNS, black for problems. Beginners scroll through, see a few black lines, and think they’ve “found something.” They haven’t. They’ve found Wireshark’s opinion about something.
The real signal is in the shape of the conversation:
- The TCP three-way handshake. SYN, SYN-ACK, ACK. Three packets. Always. If this is slow, the connection is born sick — nothing built on top of it will be fast.
- The whoosh. A healthy data transfer has a rhythm: data, data, data, ACK, data, data, data, ACK. When that rhythm breaks — when you see data, ACK, pause, data, ACK, pause — that’s where the problem lives. Capture healthy traffic on purpose. Get used to what good looks like.
- The four-way teardown. FIN, ACK, FIN, ACK. Connections should close politely. RSTs are slammed doors. Half-closed connections are zombies. The way a connection ends often tells you more than how it started.
This is the mantra: The proof is in the packets. Not in the dashboards. Not in the application logs. Not in the user’s vibe-based “it’s slow.” In the packets.
Coming Soon: The Advanced Guide
Next up, the stuff that separates packet hobbyists from packet professionals:
- TCP Window Scaling deep-dive — why your gigabit link is moving at 30 Mbps
- QUIC protocol analysis — yes, you can analyze it, and 4.6.5’s improved QUIC dissector helps
- TLS 1.3 decryption — using SSLKEYLOGFILE to read encrypted traffic in clear (legally, on systems you own)
- Expert Info, IO Graphs, and Flow Graphs — Wireshark’s hidden analytical superpowers
- Building reusable analysis recipes — turn one-off troubleshooting into team playbooks
Until then: capture wide, filter narrow, sort by TCP Delta, and trust the packets. Packets don’t lie!
The proof is in the packets. Always.
Reach out if you have questions or comments or what to collaborate
Session Messenger: 059db238ab37c3d92615c5cc24b694da29c598cc13e27886053722404118e14271