
The Advanced Wireshark Guide (4.6.5) aka Episode 2
Because the proof is still in the packets, but now we’re going to read what they’re actually saying.

Because the proof is still in the packets, but now we’re going to read what they’re actually saying.
Recap & Where We’re Going
Last episode you got the foundation: profiles, custom columns, TCP Delta, the six display filters, and the philosophy. You can now spot a slow handshake, read the rhythm of a healthy data flow, and tell a tired TCP RST from a polite FIN-ACK teardown.
That’s enough to fix 70% of tickets.
This episode is for the other 30%, the ones that get escalated to you because nobody else can figure them out. The “we have a 10 Gbps link and rsync is doing 28 megabits” tickets. The “the CDN is fast for everyone in Frankfurt but our office in Manila gets garbage” tickets. The “this connection is encrypted, we have no logs, and the vendor swears it’s not them” tickets.
These don’t get solved by colors. They get solved by understanding what TCP is actually doing under the hood, by decrypting what was supposed to be opaque, and by building tools you can hand to your team so the next person doesn’t have to be you.
Five topics for today.
Part 1: TCP Window Scaling: The Hidden Throttle
Here’s the puzzle that will eat a week of your life if you don’t know about it.
You have a server in Frankfurt. You have a client in Manila. The link between them is 1 Gbps end-to-end, properly provisioned, with iperf showing 940 Mbps when you push UDP. RTT is 180ms (it’s a long way around the planet). You start a single TCP transfer and it… peaks at 28 Mbps. Then sits there.
No retransmissions. No packet loss. No firewall complaints. Just slow.
This is the Bandwidth-Delay Product (BDP) problem, and it lives entirely in TCP’s window size field.
The Math That Bites You
TCP’s classic receive-window field is 16 bits. That’s 65,535 bytes or about 64 KB. That number was set in 1981 when a “fast” network was T1 and nobody dreamed of gigabit links across continents.
The receive window tells the sender: “this is how much data I’ll accept before you have to stop and wait for an ACK.” It is, by design, the throttle. And the maximum throughput you can ever achieve on a single TCP connection is:
throughput = receive_window / RTTPlug in the numbers for Frankfurt → Manila with a stock 64 KB window:
65,535 bytes / 0.180 seconds ≈ 364 KB/s ≈ ~3 MbpsYou have a gigabit link. TCP’s classic window math caps you at 3 megabits. The pipe might as well be dial-up.
The fix has existed since 1992 in RFC 1323 (now RFC 7323): the Window Scaling TCP option. It’s a multiplier negotiated in the SYN packets — both sides advertise a scale factor N, and the actual window becomes:
real_window = advertised_window × 2^NScale factor of 7 multiplies your window by 128. Scale of 14 (the maximum) multiplies it by 16,384, giving you a theoretical max window of about 1 GB. Plenty of room.
What Wireshark Shows You
Open any TCP packet and expand the TCP header. You’ll see two related but different fields:
Field What it is What you see Window (tcp.window_size_value) The raw 16-bit value on the wire e.g., 502 Calculated window size (tcp.window_size) What it actually means after scaling e.g., 64,256 Window size scaling factor (tcp.window_size_scalefactor) The 2^N multiplier negotiated e.g., 128
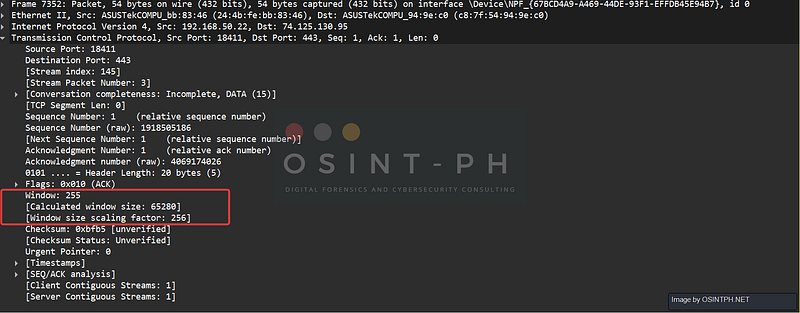
The first time you see this, the gap between “Window: 502” and “Calculated window size: 64,256” is jarring. It’s saying: “the wire bytes say 502, but because both sides agreed on scale factor 128 during the handshake, the real window is 502 × 128.”
The Gotcha That Wastes Hours
Window Scaling is only negotiated in the SYN packets. If your capture starts mid-stream, because you started Wireshark after the connection was already established, Wireshark has no idea what scale factor was agreed upon. You’ll see this:
[Window size scaling factor: -1 (unknown)]And the calculated window size will be wrong (it’ll show the raw value, not the scaled one). All your throughput math will look insane. People file bug reports about this.
Filter to find affected streams:
tcp.window_size_scalefactor == -1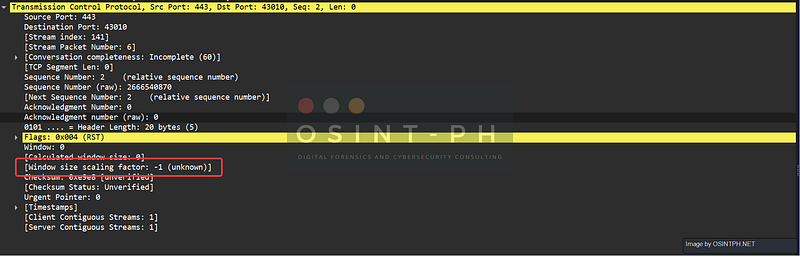
The fix: capture the connection from the start. Or, if that’s impossible, override it: Edit → Preferences → Protocols → TCP → “Scaling factor to use when not available from capture”. Set it to a sensible value (7 or 8) and Wireshark will use that as a guess. Wireshark will then label the value as “missing — taken from preference” so you know.
How to Diagnose a Real Window-Scaling Problem
- Open the trace, find the SYN packet (
tcp.flags.syn == 1 && tcp.flags.ack == 0). - Expand TCP → Options → Window scale. Look at the Shift count. This is your
N. If it's 0 or the option is missing, scaling is off. - Now find a data packet from the receiver and look at Calculated window size.
- Calculate your theoretical max throughput:
calculated_window / RTT. - If that number is close to what you’re actually getting — congratulations, you’ve found your throttle. The receiver isn’t asking for more, so the sender isn’t sending more.
- Add a column for Bytes in flight (
tcp.analysis.bytes_in_flight) and watch it. If bytes-in-flight repeatedly hits the calculated window and stalls, that's the smoking gun.
Pro-Tip: The culptrit is sometimes a middlebox. Some old firewalls and “WAN optimizers” strip TCP options they don’t recognize, including Window Scale. The result: client says “let’s scale by 128,” server says “let’s scale by 64,” but somewhere in the middle the option got eaten and one side falls back to no scaling. Capture on both sides of the suspect device. If the SYN options differ, you’ve found the offender.
Pro-Tip: The IO Graph (covered later) has a built-in Window Scaling Graph under Statistics → TCP Stream Graphs → Window Scaling. It plots the receive window and bytes-in-flight on the same time axis. If the blue line (in flight) is consistently slamming up against the green line (window), the window is your problem. If they’re far apart, it isn’t.
Note: There are other reasons that could have similar symptomps. so dont get caught up:
For example:
- TCP congestion control (e.g., CUBIC behavior under certain RTT/loss patterns)
- application-level throttling
- per-flow QoS shaping
- NIC offload artifacts (TSO/GRO skewing analysis)
Part 2 — QUIC: The Encrypted Future, but what is it?
QUIC is what HTTP/3 runs on. It is also, by 2026, what a huge slice of your “HTTPS” traffic actually is, Google services, Cloudflare, Meta, half the modern CDN ecosystem. If you haven’t touched QUIC in Wireshark yet, you’re already analyzing it without knowing.
And here’s the catch: QUIC was designed to be encrypted from the very first byte, including the handshake. There is no Server Hello you can read in the clear. There is no five-tuple stability, connections can migrate IPs mid-flow. There is no TCP three-way handshake to anchor on. Everything you learned about TCP analysis... still applies in spirit, but the surface looks completely different.
What You’re Actually Looking At
QUIC runs on UDP (almost always port 443, the same port HTTPS uses for TCP). Open a packet and expand it: you’ll see UDP, then a QUIC IETF layer with packet types like Initial, Handshake, 0-RTT, and 1-RTT. Inside those are frames (STREAM, ACK, CRYPTO, NEW_CONNECTION_ID, PING, etc.), QUIC's equivalent of TCP segments and TLS records, multiplexed together.
A few mental model shifts that help:
- QUIC connections aren’t 5-tuples, they’re Connection IDs. Two packets with completely different src/dst IPs can belong to the same QUIC connection if they share a Connection ID. This is how QUIC survives a phone switching from Wi-Fi to LTE without reconnecting.
- QUIC streams are multiplexed inside a connection. One QUIC connection can carry many independent HTTP/3 requests in parallel, each with its own stream ID, with no head-of-line blocking between them.
- Loss and retransmission are at the QUIC layer, not TCP. UDP underneath knows nothing, QUIC reinvents reliability on top.
The Filters You Need
quicAll QUIC traffic. Start here.
quic.long.packet_type == 0Initial packets, the QUIC equivalent of “first packet of the handshake.” If you see Initials going one way but no response, the handshake is failing.
http3HTTP/3 traffic, which is the application layer riding on QUIC. You’ll only see this populate after decryption (next section).
quic.dcid
quic.scid
The Destination and Source Connection IDs on the wire. These are how QUIC actually identifies a connection — independent of IP and port. Use them to follow a connection across an IP migration (Wi-Fi → LTE). Right-click a DCID or SCID value in any packet → Apply as Column to track it.
There’s also quic.odcid, the Original DCID — which appears after a Retry packet and tells you the client's first DCID before the server told it to use a new one.
quic.connection.numberThis is not the on-wire Connection ID. It’s Wireshark’s own per-trace counter, connection 0, 1, 2…, assigned in the order Wireshark sees QUIC conversations. Equivalent to tcp.stream for TCP. If you just want "show me only the third QUIC conversation in this trace," quic.connection.number == 2 is the filter you want.
What 4.6.5 Brings to QUIC
The 4.6.5 release notes call out updates to the QUIC dissector among many other protocols. Practically, this means better support for the latest connection-ID handling, frame parsing, and key-update logic that have been moving as the protocol matures. If you analyze a lot of HTTP/3, run 4.6.5, older versions will silently misparse some newer captures.
Pro-Tip: The single most disorienting thing about QUIC is that without decryption, the only thing you can really see is packet sizes and timing. That’s it. No SNI in the clear (in modern deployments using ECH), no method, no path, no status. If you need to actually understand what’s happening in a QUIC stream, you must decrypt, which is the next section.
Part 3: TLS 1.3 (and QUIC) Decryption with SSLKEYLOGFILE
The single most common refrain from people new to packet analysis in 2026: “It’s all encrypted, what’s even the point?”
The point is that on systems you control, encryption is not a wall. It’s a wall that has a door. The door is called SSLKEYLOGFILE, and once you understand it, you can read your own TLS 1.3 and QUIC traffic in cleartext.
Why You Can’t Just “Use the Server’s Private Key” Anymore
In TLS 1.2 with old RSA key exchange, you could hand Wireshark the server’s private key and it would decrypt traffic. Those days are over. TLS 1.3 mandates forward secrecy via ephemeral key exchange (ECDHE), the session keys are generated fresh per connection and never written to disk by the server. There is no static key that can decrypt the session after the fact.
So you don’t decrypt with the server’s key. You decrypt with the session keys themselves, which the client (browser, curl, etc.) can be told to dump to a file as it negotiates them.
The Workflow
Step 1: Set the environment variable.
The variable name is SSLKEYLOGFILE. Browsers and most modern TLS libraries (NSS, OpenSSL 3+, BoringSSL, Go's crypto/tls) check for it and dump session keys to the file path it points to.
Linux/macOS:
export SSLKEYLOGFILE=$HOME/sslkeys.logWindows (cmd):
set SSLKEYLOGFILE=%USERPROFILE%\sslkeys.logWindows (PowerShell):
$env:SSLKEYLOGFILE = "$env:USERPROFILE\sslkeys.log"Step 2: Launch the browser from the same shell.
The variable is per-process. If you set it in one terminal and launch Chrome from your Start Menu, Chrome won’t see it. Close the browser completely (kill the background processes too, Google Chrome especially loves to leave a helper running), then start it from the same shell where you exported the variable.
Step 3: Verify the file is being written.
Touch the URL of the site you want to capture, then cat (or open) the key log file. You should see lines like:
CLIENT_HANDSHAKE_TRAFFIC_SECRET <hex> <hex>
SERVER_HANDSHAKE_TRAFFIC_SECRET <hex> <hex>
CLIENT_TRAFFIC_SECRET_0 <hex> <hex>
SERVER_TRAFFIC_SECRET_0 <hex> <hex>
If the file is empty, the env var isn’t reaching the browser. Don’t go any further, fix this first.
Step 4: Point Wireshark at the file.
In Wireshark: Edit → Preferences → Protocols → TLS → (Pre)-Master-Secret log filename. Browse to your key log file. Click OK. Reload the capture (Ctrl+R, or File → Reload).
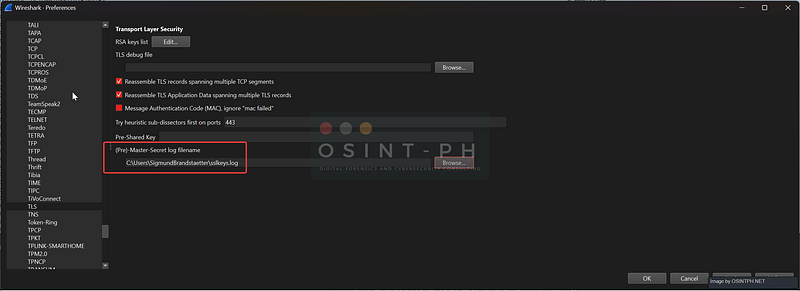
Step 5: Watch encryption melt.
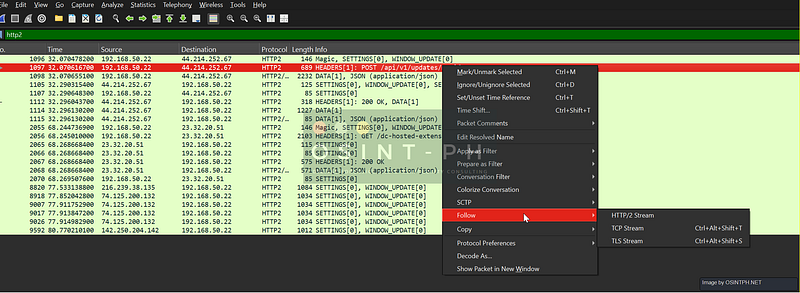
Packets that previously showed as Application Data should now decode as HTTP/2, HTTP/3, or whatever was inside. The http, http2, and http3 display filters will start returning hits. Right-click a TLS or QUIC stream → Follow → HTTP/2 Stream (or HTTP Stream).
Step 5 — Watch encryption melt.
Packets that previously showed as Application Data should now decode as HTTP/2, HTTP/3, or whatever was inside. The http, http2, and http3 display filters will start returning hits. Right-click a TLS or QUIC stream → Follow → HTTP/2 Stream (or HTTP Stream).
Validating That Decryption Actually Worked
“I set the variable and pointed Wireshark at the file” proves nothing. Lots of things can go wrong silently, the browser ignored the env var, you captured mid-handshake, the keys are for a different session. Here’s how to prove decryption is working, in escalating order of thoroughness.
The 10-second test:
Type http2 in the filter bar. (Or http if you're capturing HTTP/1.1, or http3 for HTTP/3 over QUIC.)
- Packets appear → decryption is working. Done. Move on.
- Zero packets but you know HTTPS traffic exists in the trace → decryption is silently failing. Continue below.
Sample if it worked:
The visual confirmation in the packet list:
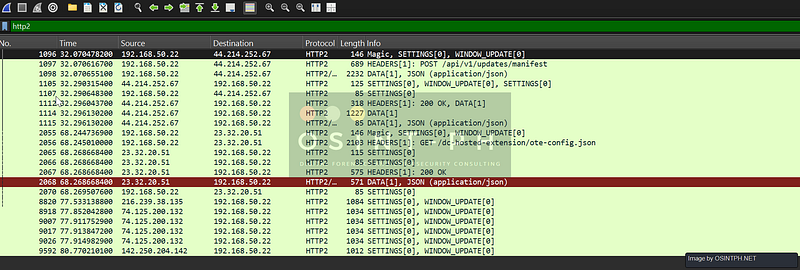
Before decryption, a TLS Application Data packet’s Info column reads:
TLSv1.3 Application DataAfter successful decryption, the same packet’s Info column expands to show the application protocol nested inside:
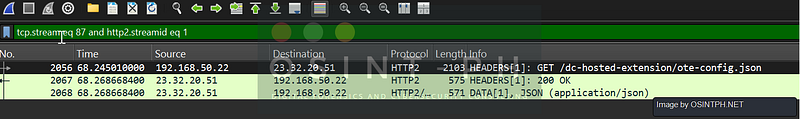
TLSv1.3 Application Data, HEADERS[1]: POST /api/v1/updates/manifest
TLSv1.3 Application Data, DATA[1], JSON (application/json)
TLSv1.3 Application Data, HEADERS[1]: 200 OK
That nested protocol info, the path, the method, the status code, the content type, is the visual smoking gun. If you see HTTP method names, URL paths, or status codes in your Info column, decryption is working. You can’t fake that.
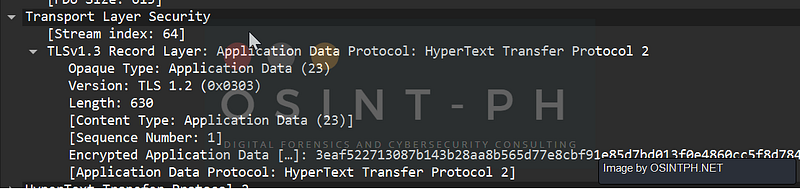
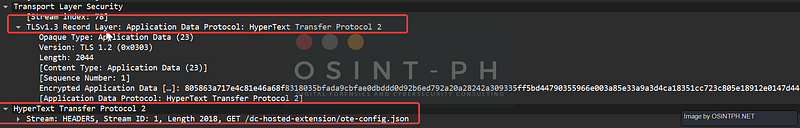
The packet details confirmation:
Click any TLS packet that looks decrypted. In the packet details pane, you should see structure like this:
Two things to confirm, and makre sure to read carefully, because the wording is subtle:
- The TLS record’s title line ends with
Application Data Protocol: <something>(e.g.HyperText Transfer Protocol 2). When decryption fails, this just saysApplication Data Protocol: Application Data,meaning Wireshark couldn't see into the encrypted payload to identify what was inside. - A separate HyperText Transfer Protocol 2 (or
HTTP, orHTTP/3) layer appears below the TLS layer, with parsed children you can expand, stream IDs, methods, paths, headers.
You will still see the line Encrypted Application Data: <hex bytes> inside the TLS record even after successful decryption. That's not a sign of failure. Those are the original encrypted bytes from the wire; Wireshark shows them for completeness. The decrypted output is presented as a separate protocol layer below TLS, not as a sibling field inside the TLS record itself.
If you see Encrypted Application Data with no application protocol annotation in the TLS title line and no HTTP/HTTP2/HTTP3 layer below, that packet didn't decrypt.
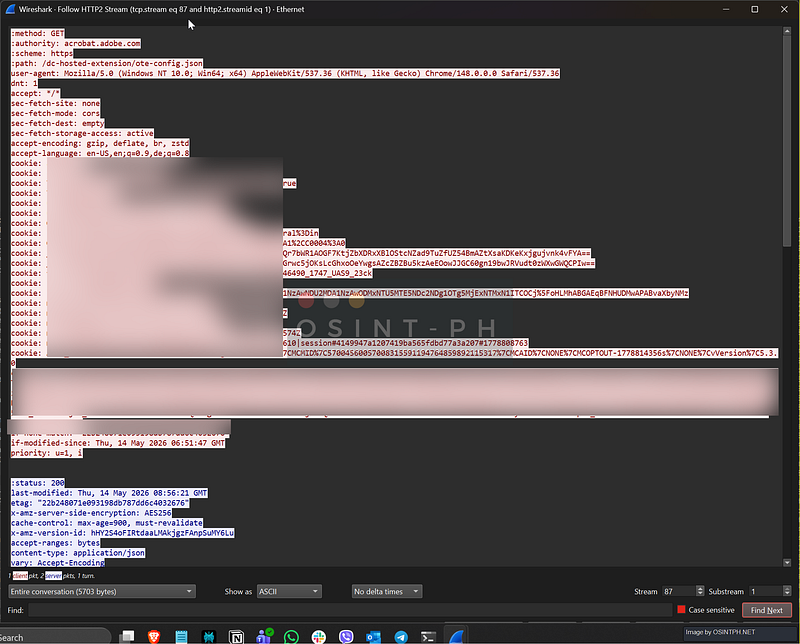
The Follow Stream test:
Right-click any decrypted packet → Follow → HTTP/2 Stream (or HTTP Stream). A dialog opens with the reconstructed conversation.
You should see:
- Real HTTP method lines:
GET /path/to/thing HTTP/2 - Real headers:
:authority: api.example.com,user-agent: Mozilla/...,cookie: ... - Real response bodies: JSON, HTML, whatever
If the Follow Stream dialog is empty or shows binary garbage, decryption isn’t working for that stream.
The debug log, when nothing else explains it:
When decryption is silently failing and you can’t tell why, Wireshark has a hidden superpower: the TLS debug log. Go to Edit → Preferences → Protocols → TLS and set the TLS debug file field (tls.debug_logfile) to a path like /tmp/tls-debug.log (or C:\temp\tls-debug.log on Windows). Click OK, reload the capture, then open that file.
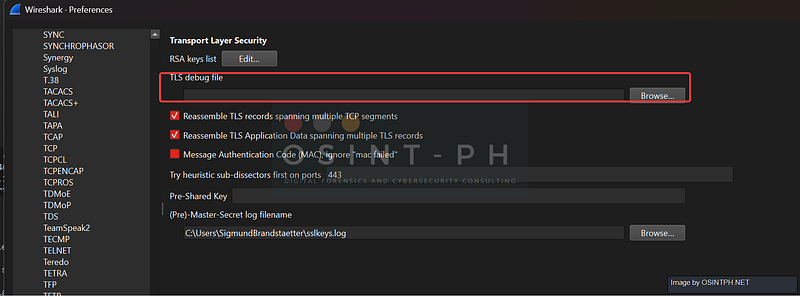
It logs Wireshark’s entire decryption attempt for every TLS record, which keys were loaded, which records matched which session, where derivation succeeded or failed. Successful entries look like:
ssl_load_keyfile: opening file
tls13_load_secret CLIENT_TRAFFIC_SECRET_0 found
tls13_change_key TLS 1.3 client key 16
decrypt_tls13_finished: success
Failures look like:
tls13_load_secret: secret not found for hash <hex>
ssl_decrypt_record: no decoder available
This file tells you exactly why decryption failed, wrong keys, missing handshake, unsupported cipher suite, all of it.
Pro-Tip: Turn the debug log on only when troubleshooting. Leave it on permanently and it’ll grow huge fast, every TLS packet writes multiple lines. Set the path, diagnose the problem, then clear the field.
The Same File Decrypts QUIC
This is the magic that surprises everyone: the TLS preference also handles QUIC, because QUIC’s encryption layer is TLS 1.3. One key log file, both protocols decrypted. No separate setup, no separate preference page. When the dissector sees a QUIC packet, it pulls keys from the same log.
Validating That QUIC Decryption Worked
QUIC validation is not the same as TLS validation, and falling back on TLS-style checks will mislead you. The protocol has its own visual cues, and one major trap that fools almost everyone the first time.
The Initial-packet trap (read this first):
QUIC Initial packets are encrypted, but with publicly-derived keys taken from the protocol spec itself (RFC 9001). Wireshark decrypts them automatically — without any key log file at all. That means:
If you look at a QUIC Initial packet and see CRYPTO, PADDING in the Info column, this is NOT proof that your SSLKEYLOGFILE setup is working. The dissector decrypted that packet using public knowledge, not your keys.The real test is whether Handshake and 1-RTT (also called Protected Payload or Application Data) packets decrypt. Those need actual session keys from your log.
The QUIC packet types you’ll see in the Info column:
QUIC packet typeWhen it appearsEncryptionInitialConnection setup, first packetsPublic keys, always readableHandshakeTLS handshake messages (Server Hello, Certificate, Finished)Needs your key log0-RTTEarly data on resumed connectionsNeeds your key log1-RTT / Protected Payload / Application DataAll actual application trafficNeeds your key log
The 10-second QUIC test:
Type one of these in the filter bar:
http3If you’re capturing HTTP/3 traffic and you get hits, decryption is working all the way up the stack. Done.
quic.frame_type == 8This filters to STREAM frames, QUIC’s equivalent of “application data is in here.” If you get hits, 1-RTT decryption is working. If you only see this filter return packets that came back as Initial CRYPTO frames (frame type 6), keys aren’t being applied to protected data.
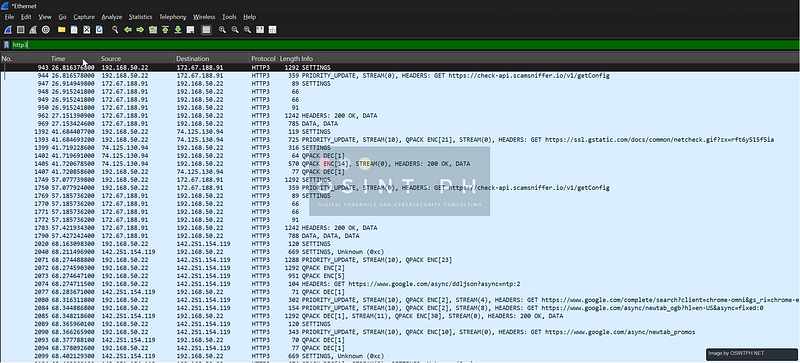
The visual confirmation in the Info column:
Without working keys, your 1-RTT packets read:
Protected Payload (KP0), DCID=cf4d6e8c2c7b43a2That’s it. Wireshark sees the packet, identifies it as 1-RTT, reads the unencrypted header, and stops. The payload stays as opaque bytes.
With working keys, the same packet reads:
STREAM(0), ACK, DCID=cf4d6e8c2c7b43a2The frame types inside the packet are now visible, STREAM, ACK, MAX_DATA, PING, whatever was actually being sent.
For Handshake packets, the same logic applies. Without keys you’ll see Handshake, Length: 1047 and not much else. With keys, you'll see CRYPTO, ACK and the TLS Server Hello / Certificate / Finished messages parsed inside the CRYPTO frame.
The packet details confirmation:
Click any 1-RTT QUIC packet. In the packet details pane you should see:
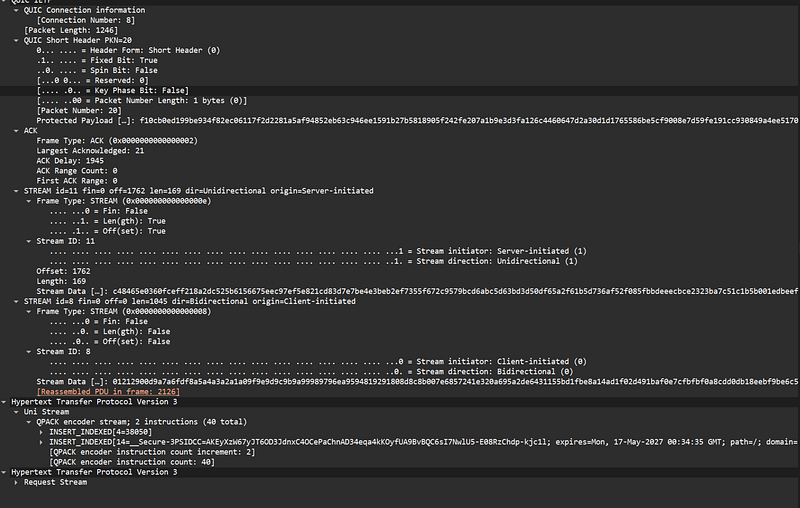
The decryption signal is: named frames (STREAM, ACK, CRYPTO, MAX_DATA, etc.) under the QUIC layer, each with parsed children. Plus an HTTP/3 layer below if this is web traffic.
The failure signal is the opposite: a QUIC layer with just header fields (DCID, packet number, length) and then either Remaining Payload: <hex> or no further breakdown. No named frames means decryption didn't happen.
The “Secrets are not available” smoking gun:
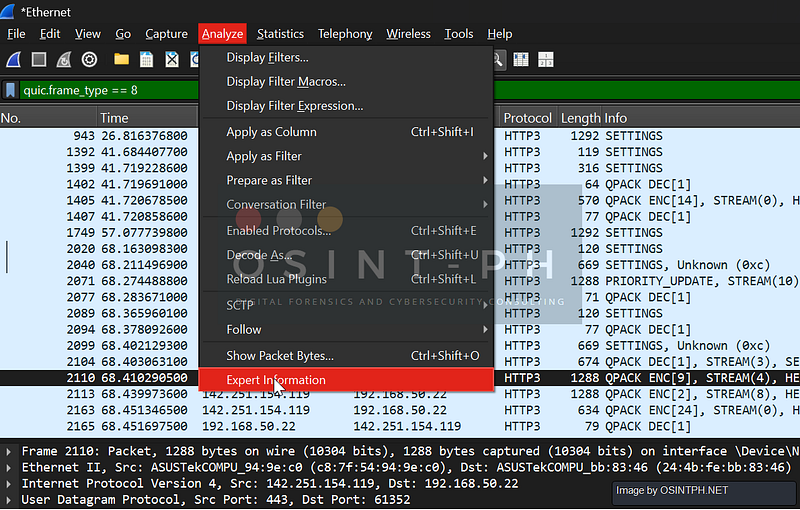
This is the single most useful diagnostic message in QUIC analysis, and it’s hidden in Expert Info. When Wireshark cannot decrypt a QUIC packet, the dissector emits an Expert Info warning that reads:
[Expert Info (Warning/Decryption): Failed to create decryption context: Secrets are not available]To see it: click a suspected-failed packet, expand the QUIC layer in the packet details pane, look for any line in square brackets containing “Expert Info” with a yellow icon. Or open Analyze → Expert Information and scroll to the Warnings section.
Even better — filter the entire trace for this exact failure:
tls.handshake.extensions.supported_version and quic(if you want to see which QUIC connections completed a TLS handshake)
Or just look at the colored circle in the bottom-left of the Wireshark window. If it’s yellow and you’re analyzing QUIC, click it — there’s a very good chance “Secrets are not available” is the top item.
The Follow QUIC Stream test:
Right-click any QUIC packet → Follow → QUIC Stream. Wireshark will reconstruct the application-level conversation across all the QUIC frames in that stream. For HTTP/3, you’ll see the request/response cleartext. If the dialog is empty or shows hex garbage, decryption failed for that connection.
The debug log works for QUIC too:
The same tls.debug_logfile preference that diagnoses TLS issues also covers QUIC, because QUIC's crypto layer is TLS 1.3 under the hood. Look for lines mentioning quic_ prefixes:
quic_get_traffic_secret: got CLIENT_TRAFFIC_SECRET_0
quic_create_cipher: success
Or failures:
quic_get_traffic_secret: secret not available for connectionQUIC-Specific Failure Modes
SymptomWhat’s actually wrongInitial packets show CRYPTO, PADDING but everything else is Protected PayloadYour key log isn't being applied to QUIC, OR you captured mid-connection. Check the key log file for entries; check Expert Info for "Secrets are not available."All QUIC packets are Protected Payload including the first onesYou probably joined the capture after the very first Initial, Wireshark needs to see the QUIC Initial packet to register the connection. Restart capture from before the connection.QUIC decrypts but http3 filter is emptyQUIC is decrypted but HTTP/3 isn't being recognized. Usually means the QUIC dissector didn't pick up the ALPN. Check Edit → Preferences → Protocols → QUIC → "Force dissector to QUIC" or check that the ALPN field in the TLS handshake announced h3.QUIC traffic on a non-443 port doesn't decrypt at allWireshark may not be recognizing the UDP port as QUIC. Add the port under Edit → Preferences → Protocols → QUIC → UDP port(s).Decryption failed warnings on some packets but not othersConnection migration. The QUIC connection moved IPs (Wi-Fi to LTE, NAT rebinding), and Wireshark may have lost track. Filter by DCID/SCID instead of by 5-tuple to follow the real connection.
What Won’t Work and Why
- Capturing only the middle of a session. TLS 1.3’s forward secrecy means the keys are derived from the handshake. No handshake in your capture, no decryption, even with the key log. Always capture from before the connection starts.
- Apps that don’t honor
SSLKEYLOGFILE. Most native mobile apps don't. Some Java apps don't unless you explicitly enable it. Olderurllib3(Python) versions don't. If the app's TLS library doesn't support it, this approach is dead on arrival; you'll need a proxy-based interception instead (mitmproxy, Burp). - Apps using certificate pinning. Pinning is about preventing MitM, not decryption. SSLKEYLOGFILE works regardless of pinning as long as the app honors the env var. But a pinned app that uses its own TLS stack (not the system one) often won’t honor it.
- Server-only captures with no client cooperation. You need the client to dump keys. Period.
Security Pro-Tip: A key log file is session-key gold. Anyone who has it can decrypt every TLS connection that contributed to it, credentials, cookies, bearer tokens, the lot. Do not commit it. Do not upload it with shared captures unless you mean to share decryption rights. Delete it after the analysis. Treat it like a password file, because effectively that’s what it is.
Pro-Tip: For repeatable captures of a single test, pointSSLKEYLOGFILEat a unique per-test path ($HOME/keys-2026-05-08-test1.log). When you're done, you can ship the.pcapngand the matching.logtogether to a colleague, and rotate the file for the next test. Don't reuse one giant log forever; it gets confusing fast.
Part 4: Expert Info, IO Graphs, Flow Graphs
You’ve been ignoring these menus. Stop.
Expert Info: Wireshark’s Built-in Triage
Analyze → Expert Information opens a panel that aggregates every observation Wireshark made about your trace, sorted by severity:
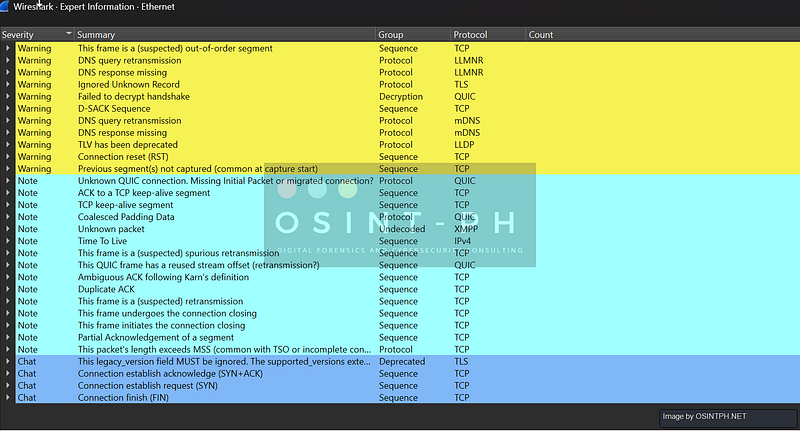
- Error (red): protocol violation, malformed packet, broken something
- Warning (yellow): likely a real problem (lost segment, RST, ACK to unseen segment)
- Note (cyan): worth checking (retransmission, duplicate ACK, zero window)
- Chat (blue): just informational (SYN, FIN, connection setup events)
- Comment: analyst-added notes
Look at the bottom-left of the Wireshark window. There’s a small colored circle that always reflects the highest severity Expert Info entry in the current display. Red circle = open the panel, you have errors.
The panel groups entries by message (“This frame is a (suspected) retransmission”, 412 occurrences). Click an entry, get the list of packets. Click a packet, jump to it. This is the fastest way to triage a long trace you’ve never seen before.
The matching display filters:
tcp.analysis.flags                   # everything Wireshark flagged in TCP
tcp.analysis.retransmission          # just retrans
tcp.analysis.duplicate_ack           # just dup ACKs
tcp.analysis.zero_window             # receiver buffer is full
tcp.analysis.lost_segment            # Wireshark thinks a segment is missing
tcp.analysis.out_of_order            # arrived out of sequence
Example for Flags
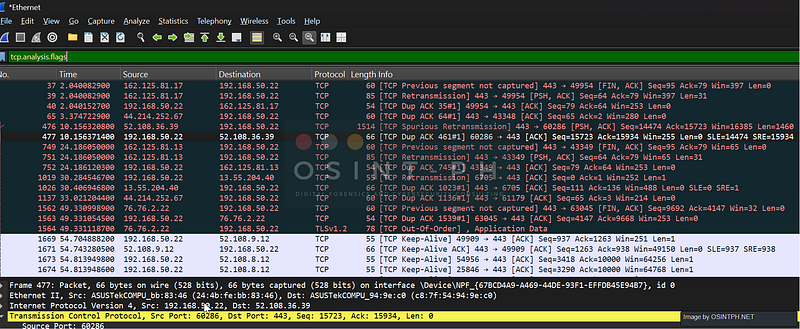
Common false positive: tcp.analysis.lost_segment fires at the very start of any capture because Wireshark joined mid-stream and hasn't seen earlier packets. If it only appears in the first dozen packets of a stream, ignore it. If it appears throughout, you have actual loss.IO Graphs: Throughput at a Glance
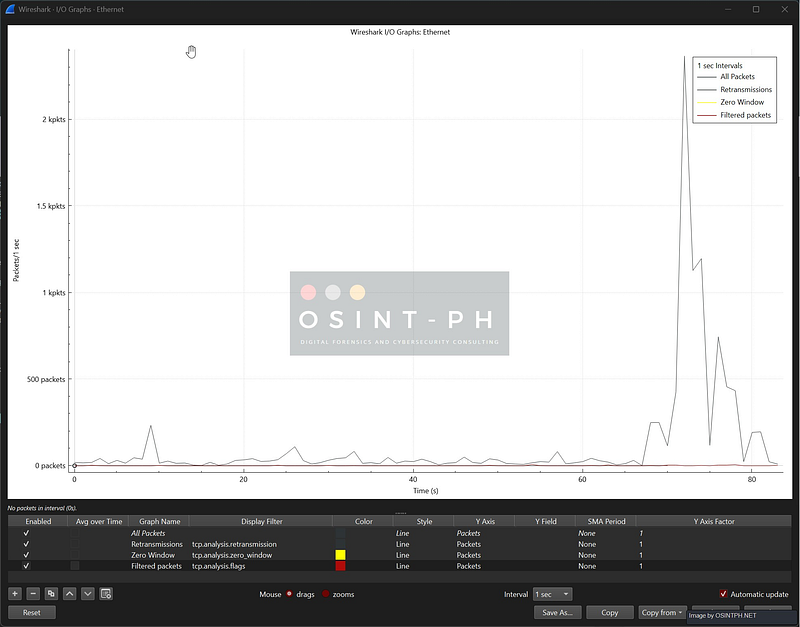
Statistics → I/O Graphs. You will use this constantly.
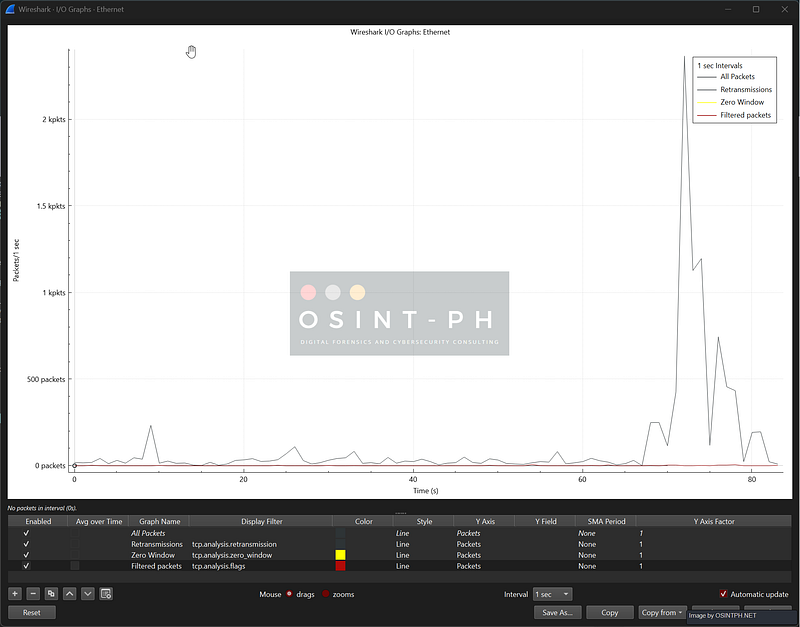
The default graph plots all packets per second over time. Useful, but the real power is in adding multiple lines, each with its own display filter, on dual Y-axes:
- Line 1: All packets (Y axis: packets/sec)
- Line 2: TCP retransmissions only (filter:
tcp.analysis.retransmission, Y axis 2) - Line 3: TCP zero windows (filter:
tcp.analysis.zero_window) - Line 4: Filtered Packets (filter:
tcp.analysis.flags)
Now you can see, at a glance, whether the retransmission rate spikes during traffic peaks (congestion!), at periodic intervals (link flap?), or sits at a constant low background (a flaky middlebox).
A few non-obvious controls that change everything:
- Y-axis unit: Switch from “Packets” to “Bits” to see actual throughput in Mbps. This is what you show your boss.
- Interval: Default is 1s. Crank it down to 100ms to see micro-bursts. Some “stable” 100 Mbps connections are actually 1 Gbps for 100ms / idle for 900ms, IO Graph reveals it instantly.
- Click a point on the graph → it jumps to that time in the packet list. This is the killer feature. See a spike at second 47? Click it. You’re now on the packet that started the spike.
Pro-Tip: For TCP performance tickets, my standard IO Graph has four lines: all packets (gray, baseline), retransmissions (red), duplicate ACKs (orange), zero windows (purple). This single graph tells you within ten seconds whether a slowness ticket is loss-driven, congestion-driven, or buffer-driven. Save it as part of your tcp-perf profile so it's there next time.Flow Graphs: The Conversation, Visualized
Statistics → Flow Graph. This draws a time-sequence diagram: source on the left, destination on the right, time flowing down, every packet a labeled arrow.
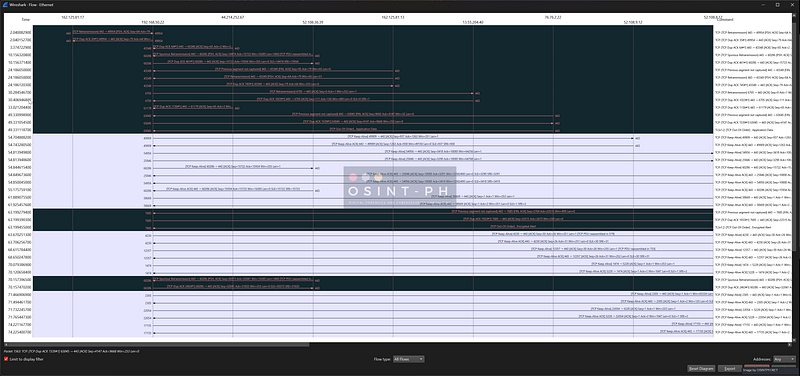
This is what you show people who don’t read packets. It is also what you should look at when a TCP handshake or teardown is misbehaving, the four-way FIN dance, the SYN/SYN-ACK timing, the order of TLS handshake messages. All of it becomes visual.
Key options inside the dialog:
- Limit to display filter: turn this on, then filter to a single TCP stream (
tcp.stream eq N) before opening the graph. Otherwise it draws every conversation in the trace and becomes unreadable. - Flow type: TCP Flow: annotates the arrows with sequence numbers, ACK numbers, flags, and window sizes. The full picture of TCP state, drawn for you.
Pro-Tip: When a “weird connection issue” gets escalated to you, first thing: filter to one TCP stream, open the Flow Graph, screenshot it, paste into the ticket. Half the time the answer is visible in that one image, a missing FIN-ACK, a RST after a SYN, an asymmetric retransmit pattern. The other half, you have a tidy artifact for the postmortem.
Part 5 — Building Reusable Analysis Recipes
Here’s the difference between a senior packet analyst and a junior one: the senior doesn’t redo work. They built it once, saved it, and now it runs forever.
In Wireshark, that artifact is the profile, and a good profile is a recipe.
What’s Actually In a Profile
Find your profile directory: Help → About Wireshark → Folders → Personal configuration. Open it. Each profile is a subfolder under profiles/. Inside, you'll find plain text files:
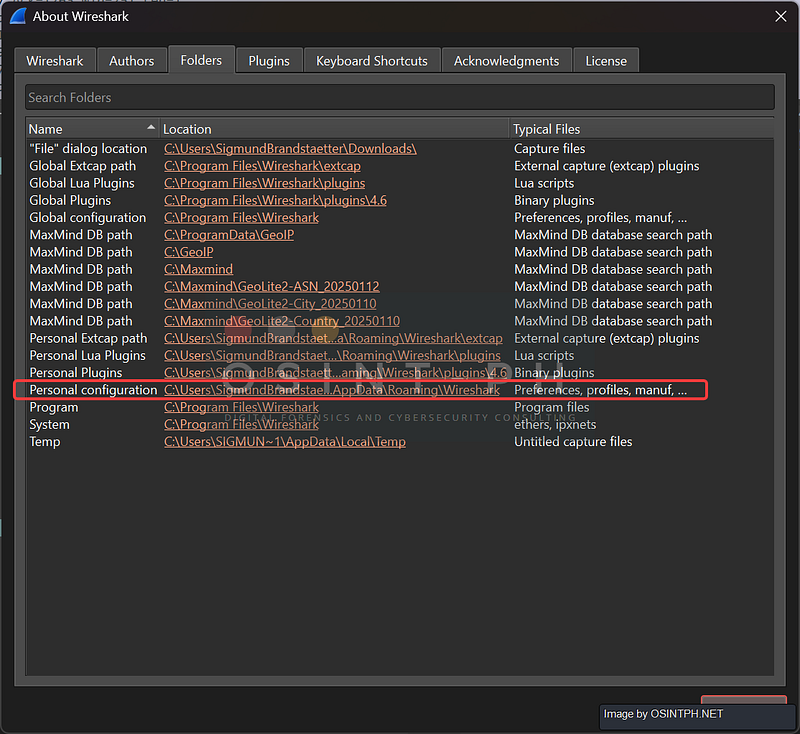
preferences            # all your Edit → Preferences settings
colorfilters           # coloring rules
dfilters               # saved display filters
cfilters               # saved capture filters
recent                 # window layout, column widths
io_graphs              # saved IO Graph configurations
There may be different ones depending on what you have done with Wireshark so far. These are text files. They’re git-friendly. They diff cleanly. Treat them as code.
The Things to Pre-Build for Your Team
1. Coloring rules. View → Coloring Rules. Build rules that color-code things your team cares about:
- TCP retransmissions: bright red background
- TLS Client Hello: green
- TCP RST: dark red
- DNS errors (rcode != 0): yellow
- HTTP 5xx responses: orange
Now any analyst opening a trace in your profile sees problems before they read a single packet.
2. Filter buttons. Right-click in the display filter bar → Filter Button Preferences (or click the + icon at the right end of the filter bar). Add one-click buttons for the queries your team runs all the time:
Resets→tcp.flags.reset == 1Retrans→tcp.analysis.retransmissionZero Win→tcp.analysis.zero_windowTLS Hello→tls.handshake.type == 1DNS Fail→dns.flags.rcode != 0HTTP 5xx→http.response.code >= 500
A new analyst joins; they import the profile; they have your team’s entire muscle memory in their toolbar.
3. IO Graph configs. Once you’ve saved a useful IO Graph (the four-line TCP perf graph from earlier, say), it gets persisted in io_graphs in the profile. Anyone who imports the profile gets the same graph configuration on their machine.
4. Columns and layout. From the previous guide. The TCP Delta + Stream + Window + Bytes-in-flight column set lives in the profile too.
The Sharing Workflow
# Bundle a profile
cd ~/.config/wireshark/profiles    # Linux example
tar czf tcp-perf-profile.tgz tcp-perf/
# Or use git
cd ~/.config/wireshark/profiles
git init
git add tcp-perf
git commit -m "Initial TCP perf analysis profile"
In Wireshark, profiles can also be imported via the dialog: Edit → Configuration Profiles → Import → from Zip File. The recipient unzips into their profile dir or imports through the UI. Done.
Security Pro-Tip: Remember the 4.6.5 patch for the profile importer (CVE-2026–5656)? That’s because profiles can carry executable preferences (like Lua plugin paths) that get evaluated on import. Only import profiles from people you trust, and on 4.6.5 or later. “Cool profile.zip” from a stranger is a code execution vector.
Pro-Tip: The single highest-leverage thing you can do for your team is build one shared profile called team-default and put it under version control. Onboarding a new analyst becomes "git clone, copy this folder, switch to the profile." A year of accumulated tribal knowledge transfers in five minutes.The Senior Analyst’s Mindset
Five themes run through everything in this guide. Internalize them and you’ll outgrow the tutorial:
- Capture from the start. Window scaling, TLS keys, TCP options, BDP math, all of it depends on seeing the SYN. If you’re walking up to a long-running connection cold, you’re already analyzing with one hand tied. Restart the connection if you can.
- Decrypt what you own. Encryption is a wall on systems you don’t control and a door on systems you do. Use the door. SSLKEYLOGFILE turns “it’s all just TLS Application Data” into “oh, the API is returning 503 on the third request.”
- Graph before you grep. IO Graphs and Flow Graphs make patterns visible that ten thousand packets in the list never will. When a trace gets confusing, visualize it.
- Build the tool once. Every profile, coloring rule, filter button, and IO Graph config you save is a debt paid forward to your future self at 2 AM. Capture filters tonight save callbacks at midnight.
- The proof is still in the packets. It always was. Window scaling is in the SYN options. The retransmission storm is in the Expert Info. The encrypted secret is in the key log. None of this requires guessing, it requires looking.
Where Next
You’ve now got the toolkit. Real growth from here is just reps, capture, analyze, get surprised, look it up, capture again. Some things to put on your radar:
- SharkFest. The annual Wireshark conference (US 2026 is in Nashville). The talks land on YouTube within weeks; watch them on lunch breaks.
- Sample captures from the wild. The Wireshark wiki SampleCaptures page has hundreds of real protocol traces. Open one a week.
- Build something painful, deliberately. Set up a slow Wi-Fi link with
tc netem. Capture anrsync. Watch the window scale, the retransmissions, the bytes-in-flight stall. The fastest way to understand TCP is to break it on purpose and read the bodies. tsharkfor automation. Everything in Wireshark works at the command line viatshark. Once you know what you're looking for visually, automate it.tshark -r capture.pcap -Y 'tcp.analysis.retransmission' -T fields -e frame.time_relative -e ip.src -e ip.dstbuilds a CSV of every retransmission with timestamps. Pipe that to anything.
That’s the path. Capture wide. Filter narrow. Decrypt what you own. Graph the patterns. Build the tools.
The proof, as always, is in the packets.
Reach out if you have questions or comments or what to collaborate
Session Messenger: 059db238ab37c3d92615c5cc24b694da29c598cc13e27886053722404118e14271