
Building a Self-Hosted Dark Web Monitoring Portal in 30 minutes
In today’s article, we will turn a local box running Ubunto into an Automated Dark Web Monitor. It will scan a list of target onion sites…

In today’s article, we will turn a local box running Ubunto into an Automated Dark Web Monitor. It will scan a list of target onion sites and host a “Status Page” accessible via Tor, all without opening a single port on your home router.
Obviously, this is just a first step, with a few hard coded ONION links that are being monitored. In the next article, we will expand this to include getting a list of ionion links from certain repository and perform somre more automated monitoring, with dynamic removal and further information gathering.
Phase 1: OS Hardening
Since this machine is sitting on your local network, we need to ensure it’s locked down. Unlike a VPS, we don’t need to worry about provider monitoring probes. The level to which you will do this depends on where you host this, since in this case, its a local VM, but it could run literally on any Cloud Provider. I use OVH cloud for all my VPS and dedicated Server needs.
Basics first
Ensure your fresh Ubuntu install is up to date.
sudo apt update && sudo apt upgrade -yNext: Creating the Analyst User
Never run your persistent scripts as root.
sudo adduser osint_lab
sudo usermod -aG sudo osint_lab
su - osint_lab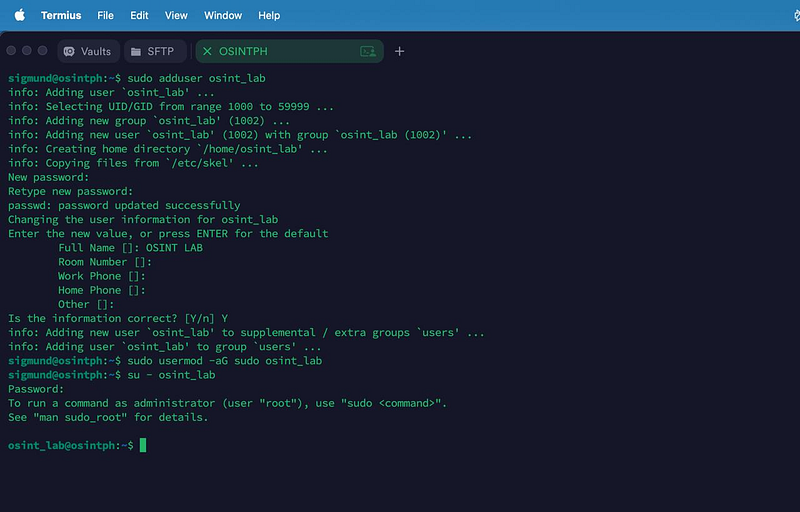
Firewall
Here is the beauty of Tor Hidden Services: You do not need to port forward. Your machine initiates the connection to the Tor network outbound. Therefore, if we want to, we can block all incoming traffic from the internet. Just make sure you consider any other services you are hosting on this box.
We will configure the firewall to allow SSH access only from your local network (LAN) so you can manage the box from within your home, but deny everything else. You could also do this via services such as ZeroTier so you are able to access from outside your home as well. I did a video about that previously, I am sharing it here, though it sure needs some updating :).
If you do not have it yet, install ufw
sudo apt install ufw -yDeny all incoming by default
sudo ufw default deny incomingAllow outgoing (so Tor can talk to the world)
sudo ufw default allow outgoingAllow SSH only from your LAN (Replace 192.168.50.0/24 with your subnet)
sudo ufw allow from 192.168.50.0/24 to any port 22Enable the firewall
sudo ufw enable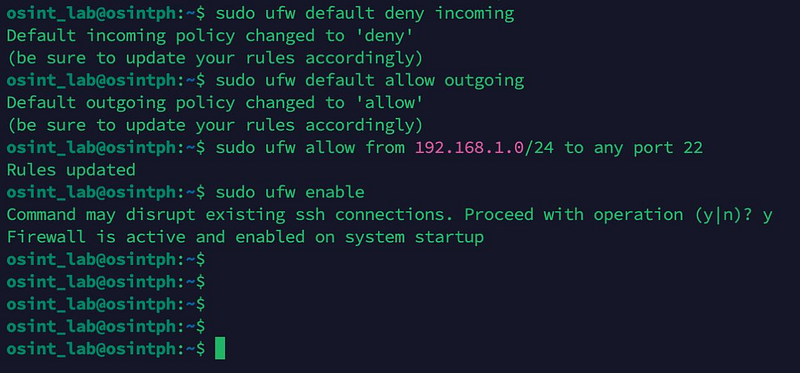
Verification: Try to SSH into your box from your laptop on the same network that you allowed. It should work. Try to access it from outside your house (if you could); it should fail.
The Hidden Service Infrastructure
We need Tor to do two things:
- Proxy: Allow our Python script to visit dark web sites (SOCKS5h).
- Host: Allow us to publish the report as a website (Hidden Service).
Install Tor
sudo apt install tor nginx -y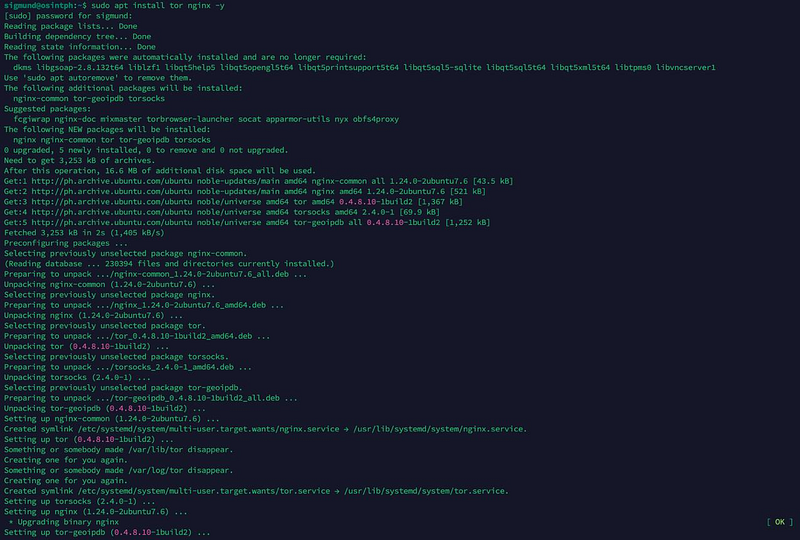
Configure Tor
We need to edit the torrc file to enable the hidden service.
sudo vi /etc/tor/torrcAdd/Uncomment the following lines:
Enable the SOCKS proxy for our scanner script
SocksPort 9050
Configure the Hidden Service (The Blog/Report)
HiddenServiceDir /var/lib/tor/onion_monitor/
HiddenServicePort 80 127.0.0.1:80
Apply Changes
Restart Tor to generate your keys.
sudo systemctl restart tor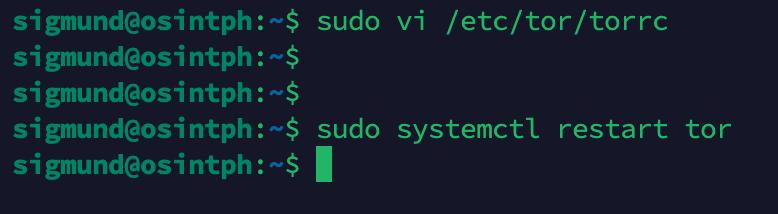
Get Your Address
Find out what your new dark web URL is:
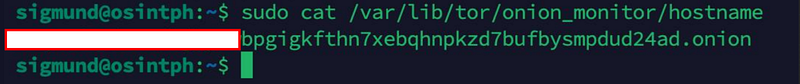
sudo cat /var/lib/tor/onion_monitor/hostnameSave this address (e.g., v2xyz…onion). This is where your report will be published.
Phase 3: The Python Environment
We’ll use a virtual environment to keep our dependencies clean.
sudo apt install python3-venv python3-pip -y
mkdir ~/dark-monitor
cd ~/dark-monitor
python3 -m venv venv
source venv/bin/activate
# Install libraries
# 'requests' for fetching pages
# 'pysocks' for routing through Tor
# 'stem' for controlling the Tor process
pip install requests pysocks stem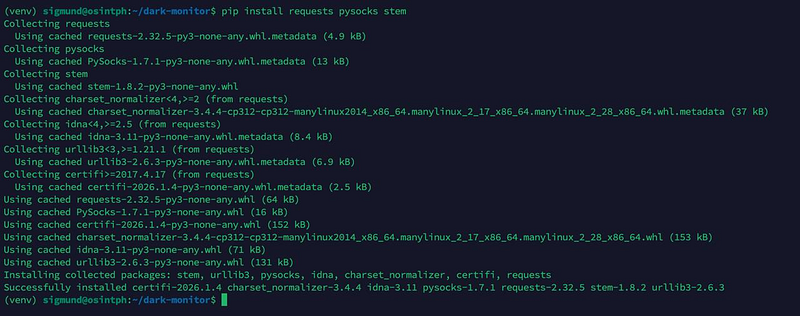
The Scanner & Publisher Script
This is a short script that scans your targets and generates a static HTML file that Nginx can serve. This turns your scanner into a live blog. Feel free to use it and modify it to your needs.
Create scanner.py:
vi scanner.pyPaste this code:
import requests
import socks
import socket
import datetime
import urllib3
import re
import time

# Suppress SSL warnings
urllib3.disable_warnings(urllib3.exceptions.InsecureRequestWarning)

# --- CONFIGURATION ---
OUTPUT_HTML = "/var/www/html/index.html"

# TARGET LIST
TARGETS =

# Configure Tor Proxy (Remote DNS Resolution)
PROXIES = {
    'http': 'socks5h://127.0.0.1:9050',
    'https': 'socks5h://127.0.0.1:9050'
}

HEADERS = {
    'User-Agent': 'Mozilla/5.0 (Windows NT 10.0; rv:109.0) Gecko/20100101 Firefox/115.0'
}

def get_page_title(html_content):
    """Simple regex to extract the <title> tag"""
    try:
        match = re.search(r'<title>(.*?)</title>', html_content, re.IGNORECASE | re.DOTALL)
        if match:
            return match.group(1).strip()[:40]  # Truncate to 40 chars
    except:
        pass
    return "Unknown Title"

def check_site(url):
    try:
        start_time = time.time()
        # Timeout 60s
        resp = requests.get(url, proxies=PROXIES, headers=HEADERS, timeout=60, verify=False)
        latency = round(time.time() - start_time, 2)

        title = get_page_title(resp.text)

        if 200 <= resp.status_code < 300:
            return "UP", "green", f"{latency}s", title
        elif resp.status_code == 403:
            return "UP (Blocked)", "orange", f"{latency}s", "403 Forbidden"
        else:
            return "ISSUES", "orange", f"{latency}s", f"Status {resp.status_code}"

    except requests.exceptions.ConnectionError:
        return "DOWN", "red", "-", "Connection Failed"
    except requests.exceptions.Timeout:
        return "DOWN", "red", ">60s", "Timed Out"
    except Exception as e:
        return "ERROR", "red", "-", str(e)[:30]

def generate_report():
    # FIX: Get local time with correct Timezone Name (e.g., PST/CST)
    now = datetime.datetime.now().astimezone()
    timestamp = now.strftime("%Y-%m-%d %H:%M %Z")

    html_content = f"""
    <!DOCTYPE html>
    <html>
    <head>
        <title>Dark Web Observatory</title>
        <meta http-equiv="refresh" content="300">
        <style>
            body {{ font-family: 'Courier New', monospace; background: #0d0d0d; color: #e0e0e0; padding: 20px; }}
            h1 {{ color: #00ff00; text-transform: uppercase; border-bottom: 2px solid #333; padding-bottom: 10px; }}
            table {{ border-collapse: collapse; width: 100%; max-width: 1400px; margin-top: 20px; font-size: 0.9em; }}
            th, td {{ border: 1px solid #333; padding: 12px; text-align: left; vertical-align: middle; }}
            th {{ background-color: #1a1a1a; color: #fff; text-transform: uppercase; letter-spacing: 1px; }}
            tr:nth-child(even) {{ background-color: #111; }}
            a {{ color: #888; text-decoration: none; }}
            a:hover {{ color: #fff; text-decoration: underline; }}
         .green {{ color: #00ff00; font-weight: bold; background-color: #001a00; text-align: center; }}
         .orange {{ color: #ffa500; font-weight: bold; background-color: #1a1000; text-align: center; }}
         .red {{ color: #ff3333; font-weight: bold; background-color: #1a0000; text-align: center; }}
         .small {{ font-size: 0.85em; color: #999; }}
         .title-text {{ font-style: italic; color: #aaa; }}
        </style>
    </head>
    <body>
        <h1>/var/log/onion_status</h1>
        <p>Last Scan: {timestamp}</p>
        <table>
            <tr>
                <th style="width: 15%">Target Name</th>
                <th style="width: 35%">Onion Address</th>
                <th style="width: 8%">Status</th>
                <th style="width: 8%">Latency</th>
                <th style="width: 34%">Page Title / Error</th>
            </tr>
    """

    print(f"[*] Starting scan at {timestamp}")
    for target in TARGETS:
        print(f"  > Scanning {target['name']}...")
        status, color, latency, detail = check_site(target['url'])
        print(f"    Result: {status} ({latency}s)")

        html_content += f"""
            <tr>
                <td>{target['name']}</td>
                <td class="small"><a href="{target['url']}">{target['url']}</a></td>
                <td class="{color}">{status}</td>
                <td style="text-align: center;">{latency}</td>
                <td class="title-text">{detail}</td>
            </tr>
        """

    html_content += """
        </table>
        <p style="margin-top:50px; font-size: 0.8em; color: #555;">
            <i>Generated by Automated Local Sentinel (Ubuntu 25.04)</i>
        </p>
    </body>
    </html>
    """

    try:
        with open(OUTPUT_HTML, "w") as f:
            f.write(html_content)
        print(f"[*] Report successfully updated")
    except PermissionError:
        print("[!] Error: Cannot write to /var/www/html.")

if __name__ == "__main__":
    generate_report()
Permissions Fix
By default, the osint_lab user cannot write to /var/www/html. Let’s fix that so our script can update the website.
sudo chown -R osint_lab:osint_lab /var/www/htmlAutomation
We want this to run every hour.
crontab -eAdd:
0 * * * * /home/osint_lab/dark-monitor/venv/bin/python3 /home/osint_lab/dark-monitor/scanner.pyAccessing Your Observatory
Open the Tor Browser on your laptop or phone.
Paste the hostname you generated in the earlier steps.
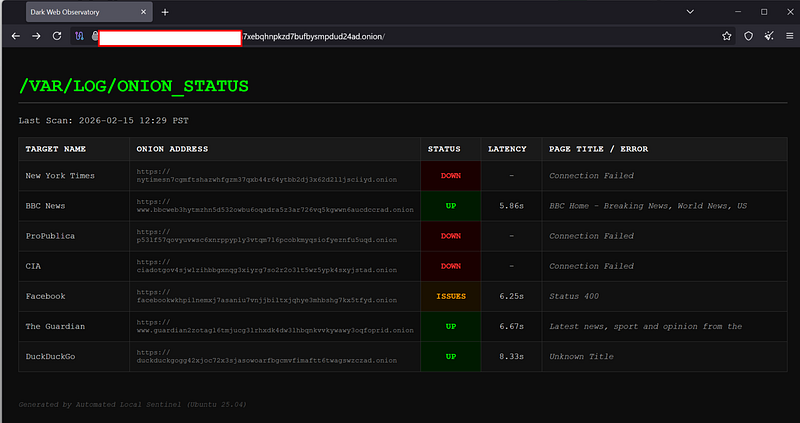
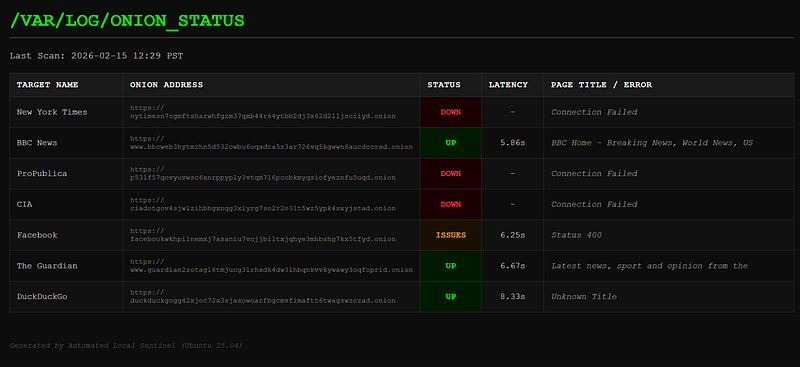
You will see your self-hosted, auto-updating dashboard.
I have made sure that there are a few wrong URL’s to show the differents statuses you will get back. It would look like this:
You can reach out to me via Session Messenger: 059db238ab37c3d92615c5cc24b694da29c598cc13e27886053722404118e14271
As usual: